Statistics
The following general information is available to the user:
-
Total Agency sales;
-
Request frequency (RPS);
-
Cumulative number of requests for the Agency;
-
Ability to receive files detailing invoices issued under contracts by email (Picture 1).

Picture 1. «Statistic» section
Cumulative total requests
This section displays:
-
the total number of requesrs, broken down into ranges: 0-1 million, 1-2 million, 2-10 million, 10-50 million, 50-100 million, 100-200 million, and 200-500 million requests. The data is presented on a monthly chart, cumulatively to the previous date;
-
the current number of requests for the month in numerical format (as of the previous date).
Statistics are available for the current month and the two previous months (Picture 2).

Picture 2. «Cumulative total queries»
Request Frequency (RPS)
The section displays:
-
MAX, AVG, MIN rps (number of requests per second) metrics in the range from 0 to 200 rps with tariffs divided according to the contract;
-
numerical values and graph (Picture 3).

Picture 3. «Request Frequency»
Sales (number of ET and EMD coupons)
The section displays:
-
the number of coupons divided by the Agency’s connected sessions;
-
the ability to view sales for previous months - the maximum historical period is 2 months (Picture 4).

Picture 4. «Sales»
The «Statistics» section contains brief information about the Agency: its name and code. It is also possible to navigate to the «Agency» section by clicking on the arrow on the right (Picture 5).

Picture 5. Information about the Agency
Statement Details
To receive a detailed statement of your invoices, click the «Statement Details» button, then select the month for which you want a statement, and enter your email address (Picture 6). Files will be sent to this address within 10 minutes.
Note: The «Statement Details» button may be inactive if there are no account detail files for the Agency.
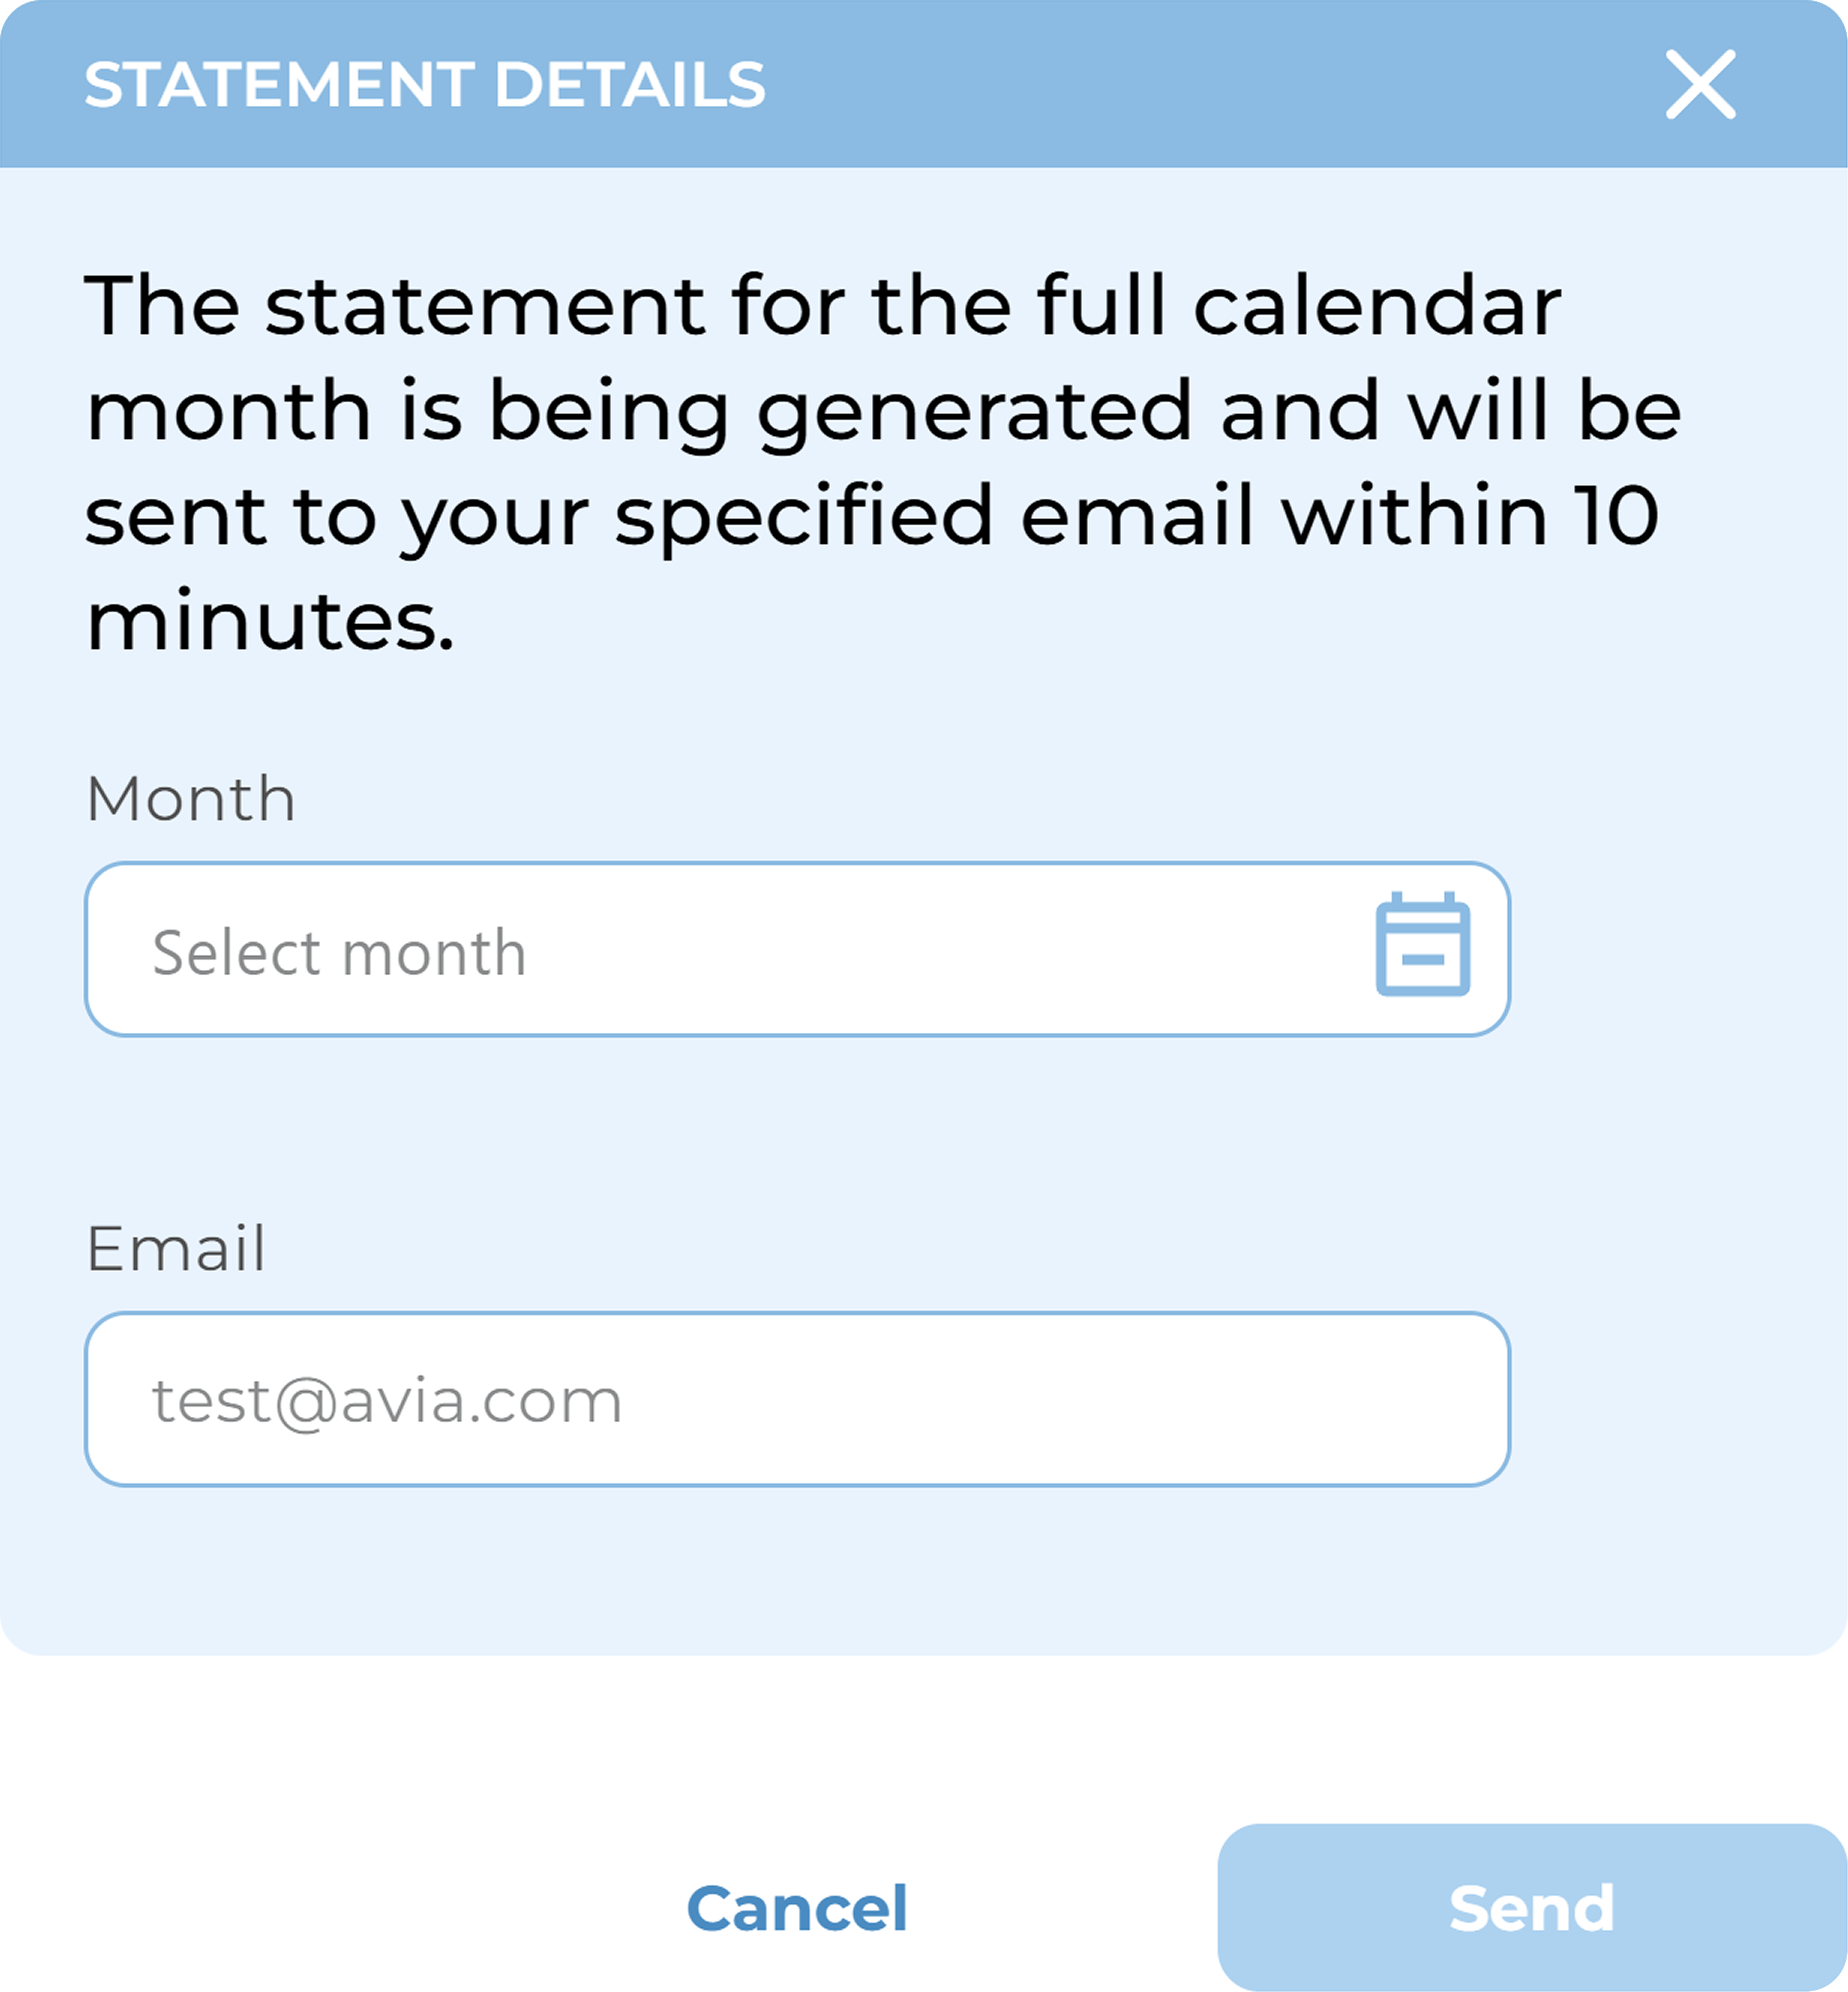
Picture 6. Statement Details
To select a month, click the «Select Month» field. This will open a calendar for selecting the month (Picture 7).
Notes:
-
If some months are unavailable for selection in the calendar (these months are highlighted in gray), this means there are no detail files for the selected month.
-
Months available for selection will be displayed in black.
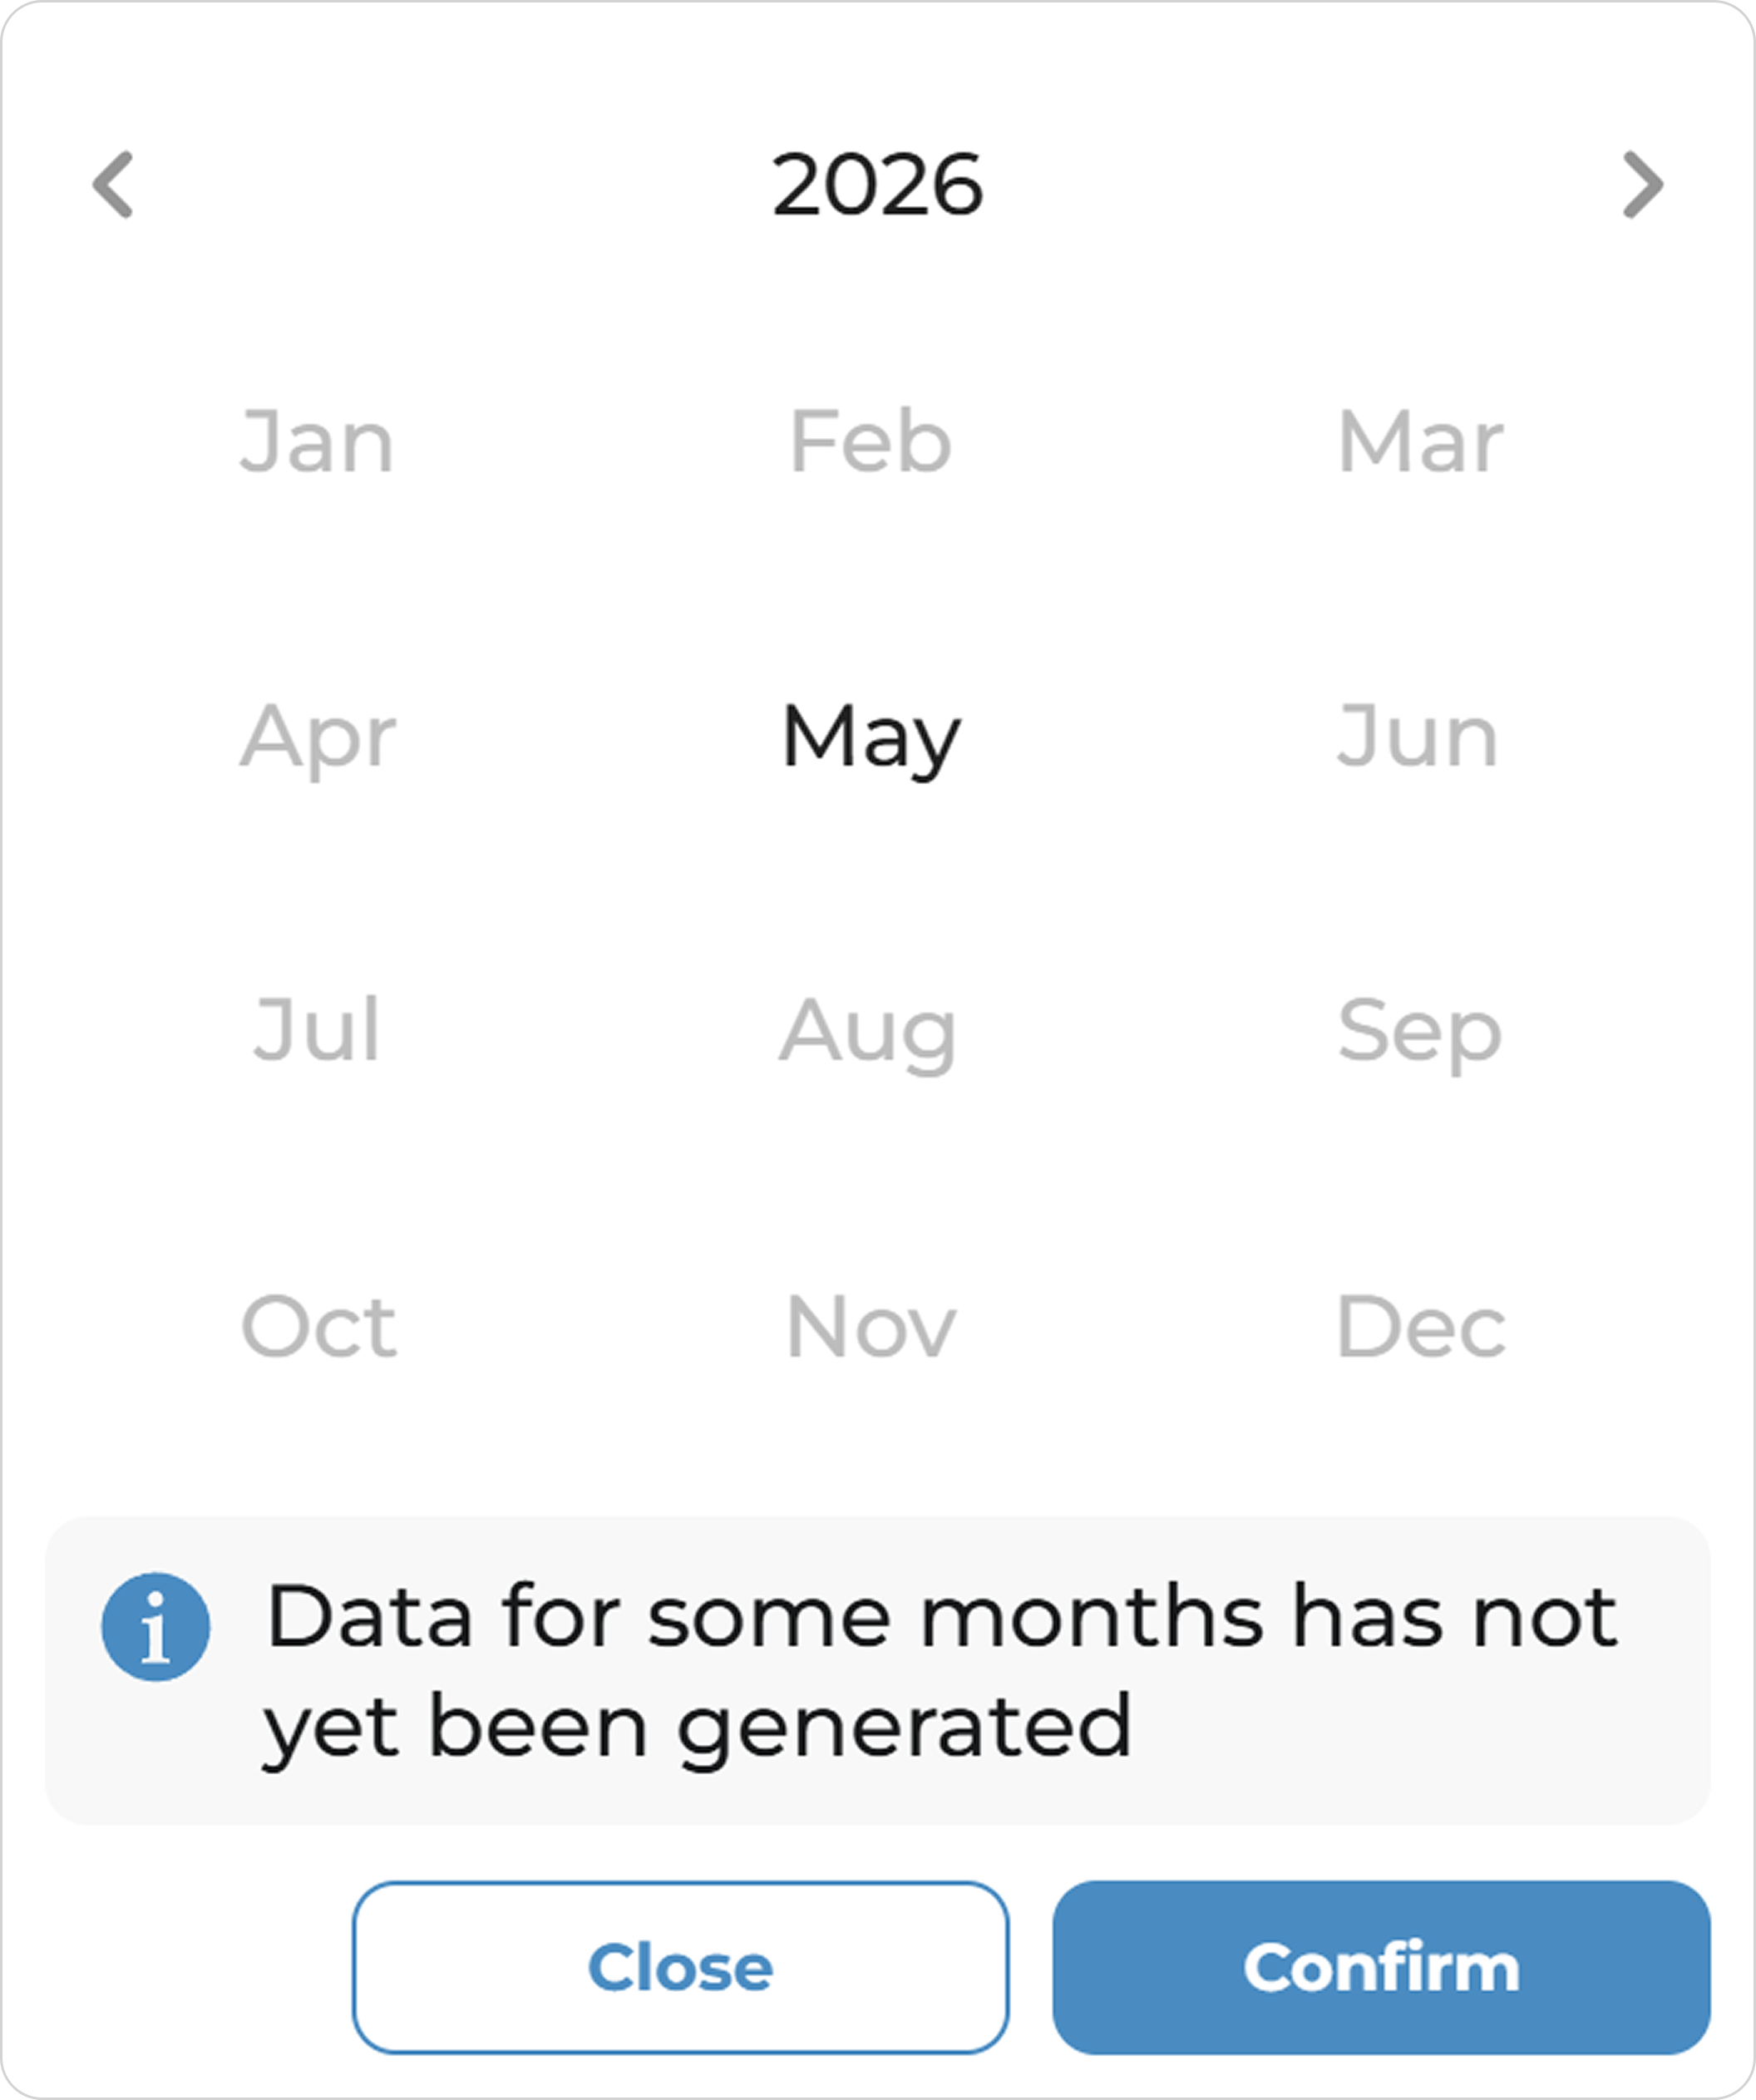
Picture 7. Month picker